

Core Algorithms, Parameters, and Formulas
In industrial color quality control and color difference management scenarios, tristimulus colorimeters and spectrophotometers utilize optical and mathematical algorithms to convert colors—which are often difficult for the human eye to distinguish precisely—into standardized numerical values. This article provides a concise breakdown of the operating principles, key color parameters, and core algorithms of both instrument types, while also elucidating the technical logic behind Delta color measurement instruments. Sanyuanse independently develops colorimetry algorithms, offering industrial-grade spectrophotometers with ΔE≤0.005, supporting the full CIE Lab/XYZ/LCh color spaces, and matching intelligent color matching software. It solves color difference control problems in plastics, paints, and metals, with direct supply from the manufacturer and customizable options.
II. Device Classification and Operating Principles
1. Tristimulus (Photoelectric Integration) Colorimeters
These devices simulate human trichromatic vision by directly capturing the red, green, and blue signals reflected by an object via an RGB filter system, rapidly integrating these signals to output basic color values. Advantages: Fast measurement speeds and low cost; primarily used for routine, rapid screening of color differences.
2. Spectrophotometers
These instruments deconstruct the visible light spectrum (380–780 nm), measuring spectral reflectance or transmittance wavelength by wavelength, and subsequently calculate color data using international standard algorithms (such as those defined by the CIE). Their accuracy far exceeds that of tristimulus devices; they support full-spectrum traceability and cross-device color consistency, making them ideal for high-end R&D, precision quality control, and cross-scenario color matching.
III. Core Color Parameters
1. RGB Color Space (Additive Mode)
Values range from 0 to 255, representing R (Red Luminance), G (Green Luminance), and B (Blue Luminance). These constitute the raw, foundational data for display devices and tristimulus colorimeters. 2. CIE XYZ Tristimulus Values
A universally adopted foundational color reference that eliminates device-specific deviations:
• X: Perceived Red Component
• Y: Object’s Overall Brightness/Luminance
• Z: Perceived Blue Component
3. CIE L*a*b* Uniform Color Space
A standard color space optimized for human visual perception, serving as the core for color difference calculations:
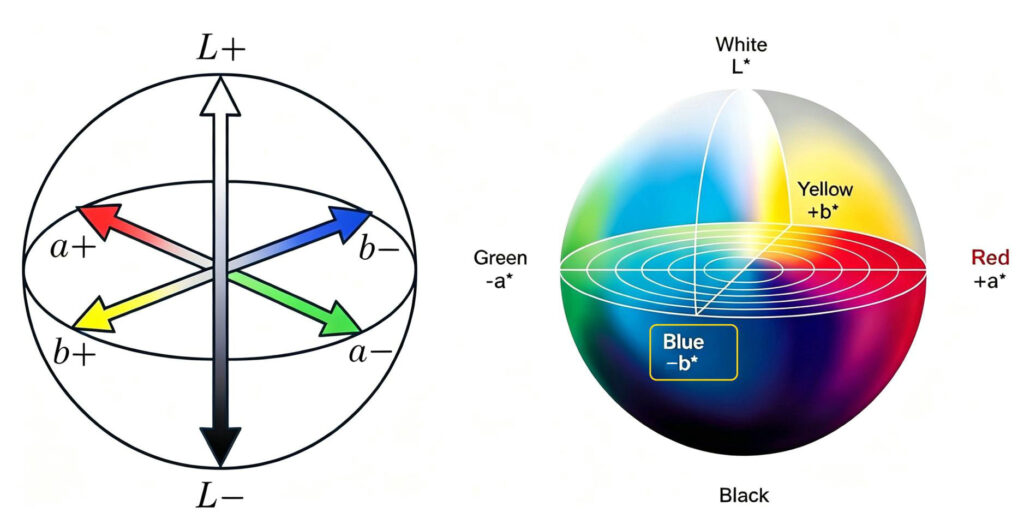
• L*: Lightness (0 = Pure Black, 100 = Pure White)
• a*: Red-Green Axis (+ = Red, – = Green)
• b*: Yellow-Blue Axis (+ = Yellow, – = Blue)
4. Key Parameters of Datacolor Measurement Instruments
In addition to L*a*b* and XYZ values, these instruments feature ΔE color difference values, Chroma (C*), Hue Angle (h°), and Spectral Reflectance [R(λ)]. Designed for high-precision calibration, cross-instrument color alignment, and professional color difference analysis, they stand as industry-benchmark devices for color measurement and calibration.
IV. Algorithmic Differences Between Tristimulus Colorimeters and Spectrophotometers
1. **Data Source:** Tristimulus colorimeters directly capture integrated RGB signals, whereas spectrophotometers capture full-spectrum spectral reflectance data.
2. **Calculation Logic:** Tristimulus colorimeters achieve color quantification through a direct RGB-to-XYZ conversion; spectrophotometers calculate XYZ values via spectral integration, which are then converted into parameters such as Lab*.
3. **Accuracy Differences:** The algorithms used in spectrophotometers can eliminate interference from light sources and ambient environments, support color difference calculations using multiple formulas, and offer significantly higher accuracy than those of tristimulus colorimeters.
4. **Application Scenarios:** Tristimulus colorimeters are suitable for rapid, low-cost color difference screening; spectrophotometers (or “Delta” instruments) are suitable for high-precision inspection, cross-device calibration, and R&D-grade color analysis.
V. Applications of Core Algorithms in Delta Instruments
Delta color measurement instruments are based on the principle of spectrophotometry and incorporate high-precision color algorithms to deliver three core functions:
1. **Spectral Data Calibration:** Ensures the accuracy of XYZ and Lab* calculations through spectral correction using a standard white tile.
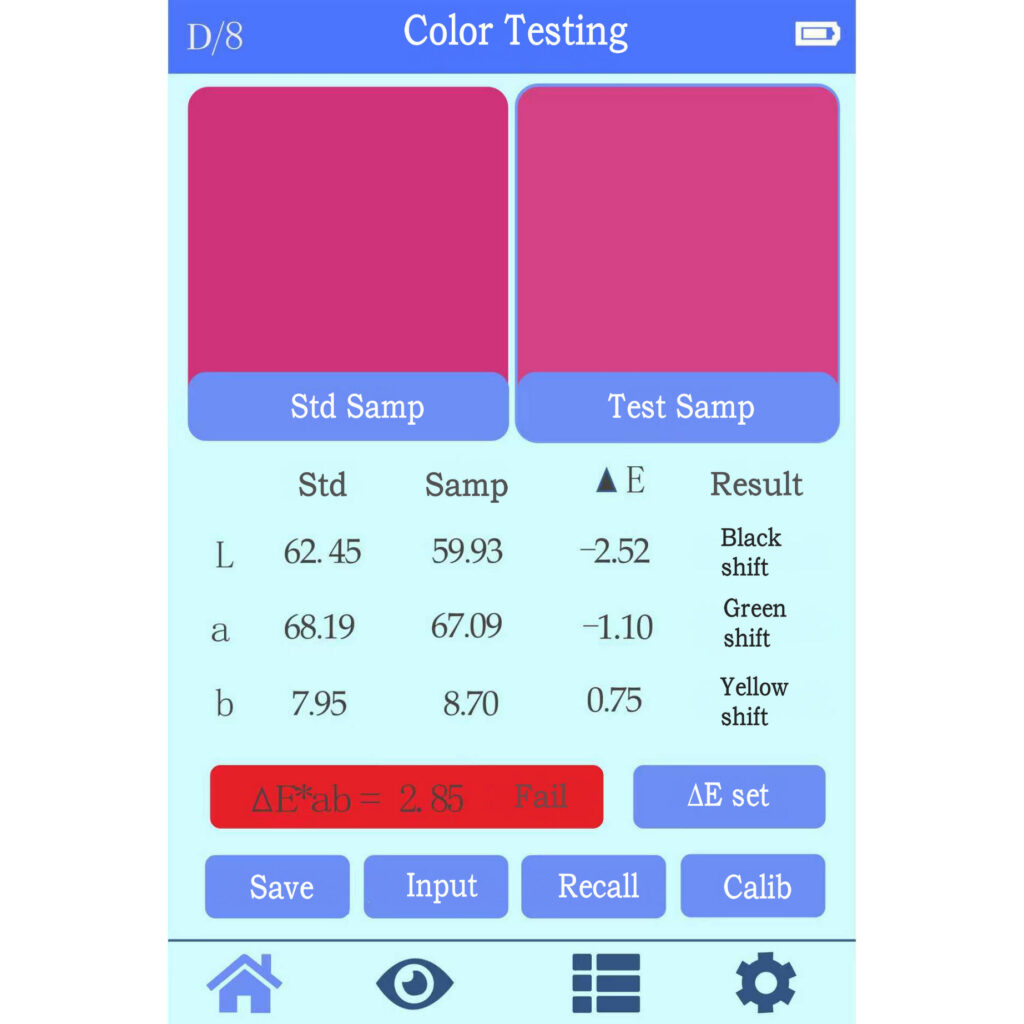
2. **Multi-Formula Color Difference Calculation:** Supports calculations using a full range of formulas—including ΔEab, ΔE94, and ΔE*00—to accommodate the quality control standards of various industries.
3. **Device Color Calibration:** Achieves color consistency across monitors, printers, and colorimeters—thereby resolving cross-device color difference issues—through the application of color conversion algorithms.
VI.Summary
The core value of both tristimulus colorimeters and spectrophotometers lies in their ability to objectively quantify color through standardized color algorithms and mathematical formulas. RGB represents the raw perceptual parameters; CIE XYZ serves as the fundamental computational core; CIE Lab* functions as the intuitive application parameter; and the various color difference formulas enable the precise quantification of color discrepancies. Among these instruments, the spectrophotometer—leveraging its full-spectrum algorithms in conjunction with the calibration and high-precision computational capabilities of Delta instruments—stands as the optimal solution for industrial color quality control and cross-scenario color matching. A thorough understanding of its core algorithms and formulas is the key to achieving accurate color measurement.